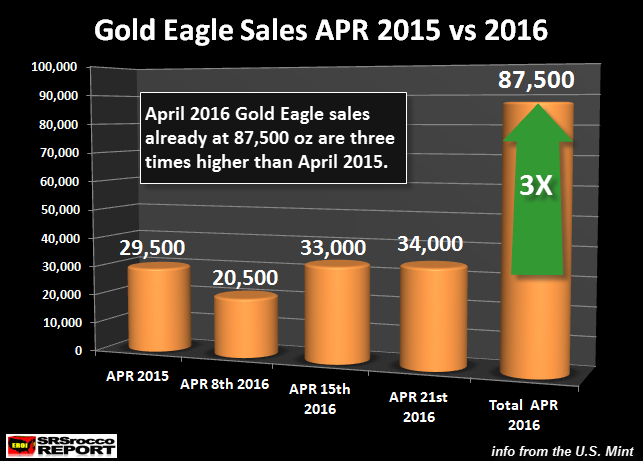
I ran across this article this morning. In essence it talks to the growth of US Gold Eagle in the first three weeks of April when compared to the entire month of April 2015.
Here is the graph to spur your interest.

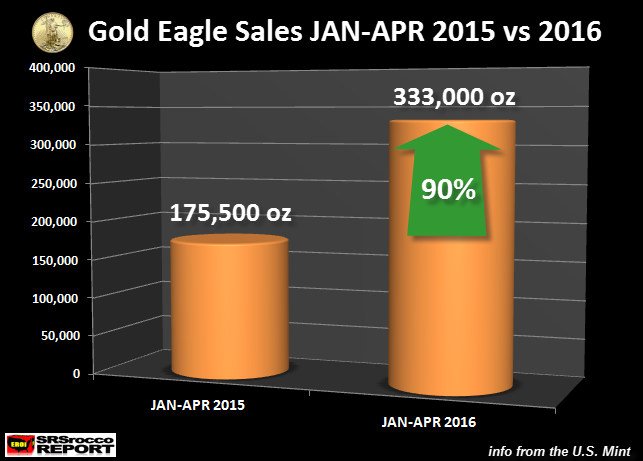
This next graph shows YTD Vs. the same period LY.

What does this all mean as prices for the last 60 days are steady?
There is a rumor out there that China is going to offer the Yuan backed with gold unlike most currencies around the world including the U$D. I have also read that the Fed is very worried that if China does offer a gold backed Yuan the value of the U$D will drop as people/markets/countries trade in their U$D for the new Yuan.
Any thoughts from the forum?
To read the whole article that these graphs came from go
here.